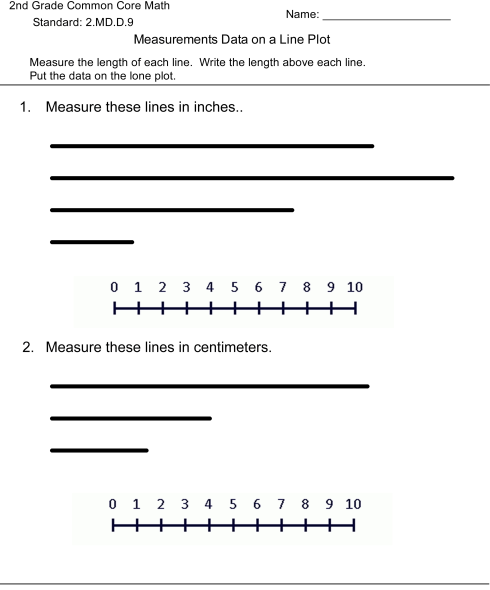
Measurement Data on a Line Plot
Line plots, or dot plots, in 2nd grade math require data and a horizontal number line.
How to put data on a line plot?
Get your line plot data. For example, this may be your class’s heights.
Look at the data set range. This is the data’s highest and lowest values.
The data set’s values should divide the horizontal number line into equal intervals. If the range is twenty, you could divide the number line into four intervals representing going up by five.
Label the number line according to your intervals.
Place a dot on the number line above each data point.
To indicate frequency, stack dots that fall inside the same interval.
Title and label the line plot.
Grade often used by:
1st Grade | 2nd Grade | 3rd Grade
Subject:
Math | Measurement and Data |
Standards:
Common Core State Standard:
2.MD.D.9
Why should kids learn to create a line plot?
Line plots are a good way for kids to show data and figure out what it means. They can help kids understand and make sense of data more meaningfully because they make it easier to see patterns and trends.
Using line plots helps kids practice essential skills like reading and interpreting data, making comparisons, and drawing conclusions based on evidence.
Line plots can be used to show a lot of different kinds of data, such as numbers, frequencies, and groups. People who don’t know how to read more complicated graphs, like bar graphs or scatter plots, may find them easier to understand.


